
Locating Winning Stocks
Fred F. Richards, Jr.
![]()
So much information, so little time!
In Forty years - - the world of financial analysis has changed!
But KISS & SF are still with us!
In 1961, if you wanted to locate good stocks, you spent hours reading annual reports, quarterly reports, various SEC reports, and research reports prepared by financial analysts and security analysts at the major brokerage firms. Almost every security analyst had access to Moody's, Barron's, the Wall St. Journal, Standard & Poor's, and many other publications. It was a major task to cull the good companies from the stock universe. As a security analyst, I spent hours on the phone talking with other analysts about companies, making field visits to companies, visiting retail outlets, and trade shows to stay abreast of developments in the economy.
Donaldson, Lufkin and Jenrette began to offer their major research reports directed at institutional investors in the early 60's. In 1963, William J. O'Neil asked Vance Griffitts to develop the first computerized database on the securities market. Rather than having rooms full of clerks calculating the OBV, or On Balance Volume, of stocks the O'Neil Stock Graphs enabled us to stay abreast of the market. The world was changing as we entered the Computer Age.
With the development of the Personal computer and the Internet, today's individual investor has available more information to make quality investment choices than ever before. The real problem, as always in investing money, is how to sift the wheat from the chaff!

Today - - the Internet and the Investor's Business Daily have changed the methodology!
If you have read Strategic Investing - Can You Add, then you know that the Watch List is simply a filter mechanism to discover stocks that have a significant potential for upside moves. In this discussion, we will focus on finding stocks for long-term investors and not stocks for day-traders.
Key internet sites which I have found invaluable.
| www.bloomberg.com | |
| www.ceoexpress.com | |
| www.investors.com | |
| www.thompsonfn.com | |
| www.nasdaq.com | |
| www.nyse.com | |
| www.cbot.com | |
| www.quicken.com |
The question then becomes . . . what criteria decides the stocks you want to invest in and what are the available Internet sources to discover the fundamentals behind those numbers. William J. O'Neil in his seminars on Investing often states that you need to only look at companies with an EPS rating above 80 or an RS rating above 80. In the Strategic Investing filter, this would give a combined number of 160.
Since most homo sapiens are lazy including myself, and O'Neil recommends that an investor own only a few stocks (no more than 20 and preferably less), it seems that it would follow that good research is necessary. In the rest of this discussion, we shall assume that you have decided to used a filter of at least 160 per O'Neil.
First Things First!

First, it is important to know whether the economy is in an up trend or downtrend. There are several sources available to help determine that basic information. One free website of great use in your research is: http://www.ceoexpress.com
If you have not discovered this website, go there now and explore. It has links to most important financial and governmental websites and after becoming a registered user, you have the ability to add and/or delete links to make it even more useful for your personal use. Explore the Business Research section which covers the world of business and the financial markets. You might want to place it on my List of Favorites in Internet Explorer, or on the Personal Tool Bar in Netscape Navigator for immediate access.
Unless you like to sell short, it is easier to make money in a market when the economy is healthy rather than a market in a downward trend. Moreover, the successful short sellers I have known during the past 40 years can be counted on one of my hands. As a habit, I don't recommend it.
If you are reading this, I assume that you are also reading the Investor's Business Daily as well as other publications for general information.
Second, it is important to be able to screen a few stocks that meet your investment criteria and objectives from the rest of the market universe. There are a number of methods which can do this for you. But after many years in this business, I have found that the simplest to use with the best results is the IBD EPS + RS screen discussed in the article on Strategic Investing - Can you Add?
Third, determine what is an acceptable number for your research. After many years of trial and error, we have decided on 194 as being the total for the EPS + RS number as our cutoff. Mr. O'Neill in his books specifies a number of 160. We do not place stocks on the updated weekly stock watch list on this website until the first time the Accumulate/Distribution (A/D) rating also becomes an A.
Hence, there are two numbers that determine whether a stock makes our watch list. First, the combined EPS + RS number must be 194 and the A/D rating must be an A. Nothing else!
The EPS and RS numbers point you in the correct direction towards stocks that have growth and profit potential. However, as you increase the combined number from 180, the universe that you must research declines from about 750 stocks to less than 100 in a year. Being lazy and also trying to invest only in a limited number of stocks at a time, we performed many what-if scenarios and ultimately decided on 194 as a cutoff. You, of course, can decide on any number you wish. But like the IBD commercial,
"only 2% of the stocks will make you rich; why do you keep buying the other 98%".
Fourth, do your fundamental research. The CAN SLIM� approach can help you in this regard. I will not repeat that information here. But listed here are some other points you may want to ponder:
| Is the company in an industry that you have good feelings toward? | |
| Has the company been the subject of a criminal indictment? | |
| What is the background of the management team and the large shareholders? | |
| What product and/or service does the company provide? | |
| What differentiates this company from its competition? | |
| How much does it spend on R&D? |
There are many websites that can assist you in looking at the fundamentals of any company. The programmers at IBD have spent a lot of man-hours revamping their website recently. The IBD Stock Check� is a quick and easy way to evaluate a stock.
If you are not comfortable with the massive information contained in the SEC files as reported, the Price Waterhouse Edgarscan site is very good. There are other sites listed in the CEOExpress Business Research SEC section that you might also want to visit. You should explore each site for a particular company and see how the information is presented.
Many on-line brokerage sites also make this information available. One of the easiest to use and make quick comparisons of various companies is the Intuit Quicken site. Quicken has the ability to tie directly to many on-line brokerage houses so that you can seamlessly make trades and update your portfolio as you trade. Another site with massive links to Financial data is the Capital PC User Group Investment Special Interest Group (CPCUG InvestSIG).
The Motley Fool website has a good record of recommendations in the past. If you have not discovered it, you should. However, it should be noted that they have just laid off 115 out of the 340 employees despite getting another round of venture capital of $30 million. They just have not figured out how to make themselves profitable.
Fifth, look at the Chart.
Obviously, you don't want to buy a stock whose chart looks like this despite good fundamentals. There are many excellent charting services available on the web as well as some that combine historical data on a CD-Rom with up-to-date numbers.
Technicians will beguile you with all types of esoteric graphs, standard deviations, etc. For me, the most obvious ones to look at as a long-term investor is the OBV (On Balance Volume), the Momentum rating, and the RS (Relative Strength Indicator). But then, I am not a technician who believes that the chart tells everything about a stock. We use Super Charts and the Quarterly Historical CD Database from Dial Data. There are other services that provide almost the same service.
Internet websites that might also be helpful.
| www.stockmaster.com/ | |
| www.bigcharts.com/ | |
| www.stockcharts.com/ | |
| www.jadco.com/ | |
| www.3dstockcharts.com/ | |
| www.iqchart.com/iqchart/ | |
| stocks.tradingcharts.com/mycharts.php |
Over the years, I have found that drawing a trend line that picks up the upper and lower price movement channels provides a reasonable perspective for looking at a stock and trying to determine if it has reached a market top or has built a support base from which to rally. Those investors who are technicians can look at charts and calculate all types of standard deviations, moving averages, on-balance volumes, relative strength indices, momentum indices, etc., which may or may not provide you with a better chance to improve your SWAG (Simple Wide A** Guess) about a stock's future direction.
Please keep this law in mind.
In the final analysis,
whichever method you decide upon,
you want to pick a stock that will make you a profit on the buy side,
or a profit on the short sale.
Sixth, rank your stocks! Based upon the amount of diversification you want in your portfolio, decide upon the number of issues to hold. O'Neil suggests 5 or 6, others more. Personally, I think that the upper limit is 20 stocks and/or bonds. I have seen portfolios under $100,000 with over 50 issues in them. It may be diversification but you will be at the mercy of the market's direction and unable to ride those few stocks for substantial gains in your portfolio when they double and/or triple.
The key is the old KISS & SF adage . . .
Keep it Simple, Stupid . . .
& Stay Focused!
Don't be afraid to increase your position in a stock that is moving ahead and making new highs!
If you find a stock that is making new highs, you might want to increase your position and weed out stocks that are not doing as well.
There is a great example of investing incorrectly. A former employee of mine bought 100 shares of Microsoft in 1982 because he liked the company and its products but could not bring himself to buy more because the stock was always higher than when he bought it. Also, he only wanted to invest $5,000 in each new stock. Well, he had a nice profit in Microsoft over the years but just think what he would have had if he had not had 75 other stocks in his portfolio.
Invest smart - and be nimble.
You can be successful if you follow the Strategic Investing philosophy. However, it is absolutely essential that you set stop loss orders and/or alerts to enable you to trigger sales to keep your profits
As Ernie Zahn used to say, "You can make a million dollars by making only 55% of your decisions correctly and cutting your losses."
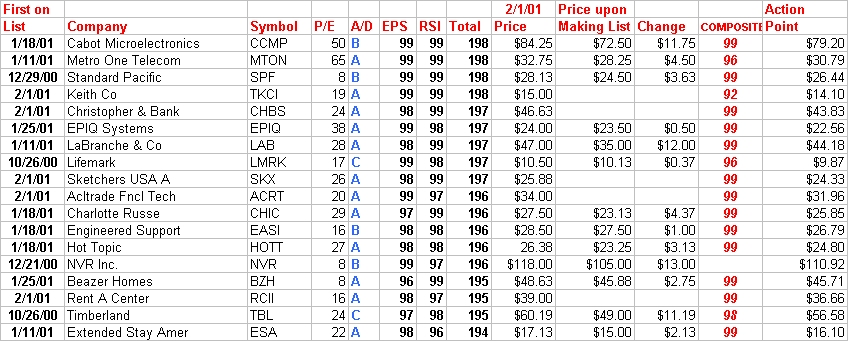
The memory jogger! Shown below is a memory help which was built on an Excel spreadsheet to help us keep track of our stock position. Something similar might be helpful to you.
So, do your research, place your bets and good luck. Always remember that the stock market is just a legalized Las Vegas casino - - only bigger and you had better be prepared!
But remember, you, and only you, are responsible for your decisions!
Fred F. Richards, Jr.
February 8, 2001
© 2001 - 2002 Adrich Corporation
![]()
Last updated - November 7, 2006