
Fred F. Richards, Jr.
![]()
Want to improve your Investment Performance?
Learn to Add
Can you add?
In this day of a dumbed-down education system, the question often arises whether students can add? If you can add two numbers together from 0-99 and get the correct answer, there is hope that you can markedly improve your stock market performance! The stock ratings contained in the Investor's Business Daily can be utilized to zero in on stocks with a significantly better chance of outperforming the market.
We are assuming that you are familiar with the Investor's Business Daily® (IBD®) and its stock tables. If not, you should go to www.investors.com to learn about the IBD stock tables and ratings. The Strategic Investing method relies heavily upon the information contained therein.
But like many things, it is not just that simple. The Strategic Investing filter requires the investor to have discipline and a willingness to learn a few simple rules. Before you decide to take on the risk of making your own investment decisions, there are some basic questions that you should ask yourself.
Questions to be asked |
||||||
1. Ask yourself who has your best interests at heart.
|
||||||
| If you have any doubt, you should stick to CD's and U.S. Treasury bills as your investment vehicle of choice! | ||||||
| 2. Do you have enough self-discipline to follow a few simple rules. | ||||||
| 3. Are you willing to spend $295 per year to get a subscription to the Investor's Business Daily® newspaper, another $200 per year for our Stock Watch List and Market Commentary, or to go to the local Public Library each Friday to obtain the necessary information. |
If you answered "You" to the first question and "Yes" to the next two, read on!
If not, stick with C.D.'s and U.S. Treasury bills.
![]()
Using Technology to Find Winning Stocks
A Winning Stock is defined as one that appreciates at least 50% from the Buy Point.
Which of the IBD® ratings are the most important?
Our research suggests that stocks which outperform the market need institutional sponsorship, increasing earnings, and that its relative strength vis-a-vis the market as represented by the S&P 500 index be very high. In the IBD® stock tables, Accumulate/Distribution (A/D) measures the institutional sponsorship while the EPS and RS ratings measures the other two important ratings.
The Strategic Investing filter uses these three components to select stocks for review.
While the other IBD® ratings can be useful, our research suggests that GS (industry relative group strength), and SMR (Sales + Profit Margins + ROE (Return on Equity)) are more confirming than identifying ratings.
Evaluating a Portfolio
We are going to assume that you have a stock portfolio and would like to evaluate its potential in the current market environment. A sample portfolio review is shown below:
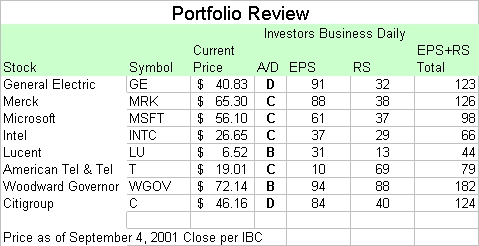
William J. O'Neil in his writings suggests that investors not invest in stocks that are below 80 in both the EPS and RS rankings. According to O'Neil, that would make a combined total of 160 as the cutoff point and I concur. However, I would set the cutoff point much higher to reduce the universe of stocks to research.
As you look at the above portfolio review, we see only one stock, WGOV, that exceeds O'Neil's cutoff point of 160. The Strategic Investing filter suggests that a much higher cutoff point is required to maximize gains and minimize the number of stocks in a portfolio. During the course of a year, the 160 cutoff point would have you spending a lot of time perusing data on over 3,000 stocks to find those few stocks that one should invest in.
Since 1994, we have tested many strategies using different filters and have found that we can maximize the number of winning stocks and minimize the number of losing trades when using a Strategic Investing filter of A + 190.
What makes the Strategic Investing filter work?
The Strategic Investing filter can work with almost any number above 160 and a B in the A/D rating. However, you will be spending a large amount of time trying to decide which one of many stocks to buy as the universe of stocks meeting the criteria is relatively large. In deciding on our filter conditions, we performed a large number of simulations and actual investment programs.
Stop for a minute and consider what the Strategic Investing filter requires:
| First, if the EPS number was above 95, it meant that the earnings per share growth for that company was in the top 5% of all companies in the database. | |
| Second, if the RSI number was above 95, it meant that the relative strength indicator for that company (momentum or on balance volume substitutes) were in the top 5% of all companies in the database. | |
| Therefore, if the combined EPS + RSI total was higher than 190, the odds were great that the companies stock would be increasing versus the rest of the market. |
Don't violate these simple rules.
- Only invest in companies with a combined EPS + RSI total of 190 initially.
- Immediately sell any stock whose price falls 6% below your initial cost per share.
- Once a profit is in a stock, decide upon an Action Point percentage to retain gains, 15% is suggested to allow for volatile stock conditions but the Action Point should never be less than 6% of your initial cost per share.
- (Optional)When the stock has appreciated 20%, double your investment and continue to double it each 10% increase thereafter.
- Sell the stock position when the combined EPS + RSI total falls below 186, or when your Stop-Loss, or Action Point is reached.
- Don't be afraid to pull the trigger on any transaction. You only have to be correct 55% of the time to WIN!
- Remember this screen means that you are only interested in the companies that are experiencing the fastest EPS growth in the fastest moving industries. Don't worry about the other dogs! You want performance!.
Want to see some Results using these rules
Shown below is the performance of a portfolio that was invested as of 4/30/99 starting with an initial capital investment of $150,000 and being invested in 16 stocks with an approximate position of $10,000 each in round lots plus one stock (ATHM) which was added to the portfolio because of its potential. The investor was a widow with almost no experience except in mutual funds and who wanted to invest the proceeds of a life insurance policy.
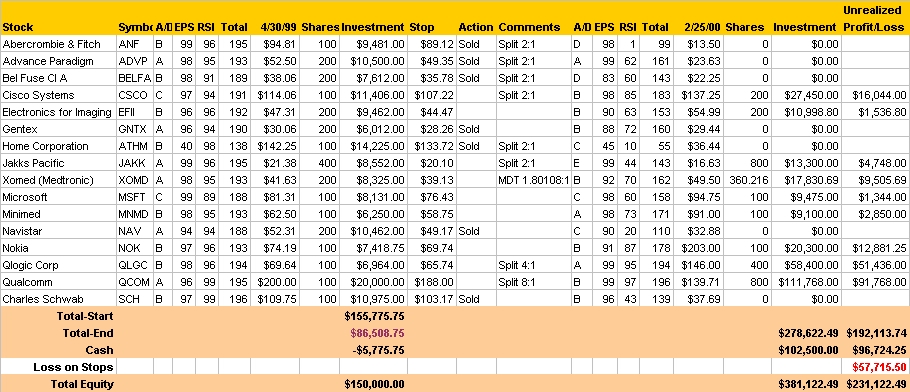
Although this portfolio did not exactly use the rules stated above, it did appreciate from $150,000 to $381,111.69 in less than 10 months, or a gain of 2.54 times the initial investment. Not too bad but the individual who managed this portfolio decided in July to not reinvest any proceeds from sales of stock and kept it in cash. This individual did not use all the above rules and picked the stocks from the Investor's Business Daily® list of the 200 best managed companies in the U.S. from its 20th Anniversary issue.
Our 1999 Investment Program
Admittedly, the year period from May 1, 1999 saw the NASDAQ soar to unknown levels and the blow-off top significantly improved our results.
From a list of all stocks beginning on 4/30/99 that had a combined EPS + RSI total of 194, the 1999 Strategic Watch Investment program took a position of approximately $10,000 in each stock. Thereafter, we followed the rules stated above except Rule 4. Initially, we found only 14 stocks that met this criteria out of all the stocks in the NYSE, ASE, and NASDAQ national markets. Quite a small universe to worry about.
The results of this investment strategy were remarkable. During the next few months, it produced winners like Qualcomm, Qlogic, JDSUniphase. Veritas, Network Appliance, Proxim, Zomax, Checkpoint, Clarify, Advanced Digital, Inforsys Technical Advisors, Cree Research, Seibal, and others. Try it for yourself, you just might make a few dollars!
As of September 30, 1999, this portfolio had increased to over $203,000 or a gain of $53,000. Not too shabby!
But the real gains were made in the next five months. As of February 25, 2000, this portfolio had increased to $624,065, or a gain of $474,065.
Gains from each year the investment program was used can be seen here.
Did your broker and/or mutual fund manager do as well?
If not, why not?
This performance was created by looking at the Weekend Review in the Investor's Business Daily® Friday's edition and spending about 20 minutes on Friday morning finding any new companies to add to the list or to remove any company that had slipped to a C or worse in the Accumulate/Distribution rating and revising each stocks stop-loss for the forthcoming week.
If you can't beat the random walk theory, or the best advice you can get from your local stockbroker, you don't have the discipline to be in the market and should stick to CD's. This strategy should beat the performance of almost any mutual fund over the same period.
But try it at your own risk . . .
Fred F. Richards, Jr.
Last updated - November 7, 2006
© 2001- 2002 - 2003 - 2006 Adrich Corporation