After six months, the major indices are negative. The massive amounts of stimulus wasted by governments trying to prevent the inevitable financial restructuring caused largely by politicians trying to rewrite the laws of economics have only served to benefit the favored few and delay the consequences of too much imprudent credit a little longer.
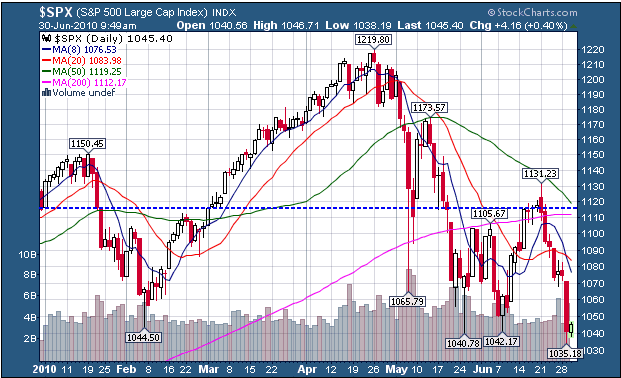
The following chart of the S&P 500 demonstrates the fluctuations of that index as it moved during the first half of 2010 responding to a statistical driven recovery fueled by hope. As the market marched through the PIIGS crisis and the attempts of the Eurozone to push the problems under the rug, investors became reluctant to accept low interest rates and the market fell to new lows as the 2nd quarter ended.
Rather than having the private sector bear the brunt of policies that were built upon greed and stupidity, politicians and their central bank counterparts have created a massive sovereign debt crisis through their attempts to paper-over the financial crisis. The politicians were afraid of the consequences of the capitalistic cycle and attempted to prevent the normal market cleansing which occurs after bubbles burst.
So what will the end-result be now that the S&P 500 support level at 1040 is in danger of being breached? In my opinion, we could very easily see the S&P 500 fall in the next six months to the 840-850 level as investors find it prudent to take capital gains before massive tax increases become effective next year.
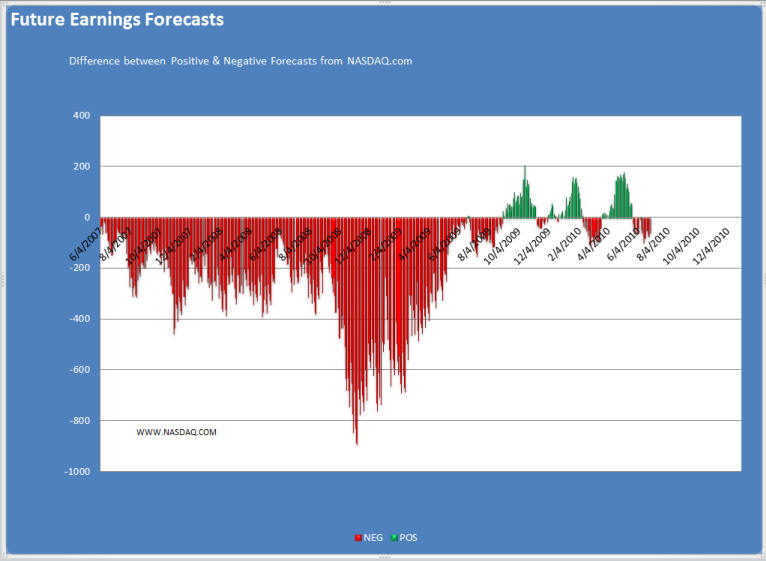
The hoped-for recovery appears to be in serious trouble. The following chart illustrates the problem. If a recovery is happening, you might expect that earnings forecasts going forward would be increasing. However, since the beginning of the year, the best that can be said is that they have not worsened significantly. Until we see a substantial increase in the number of companies expecting increases in profits, it is difficult to conclude that a recovery is in process.
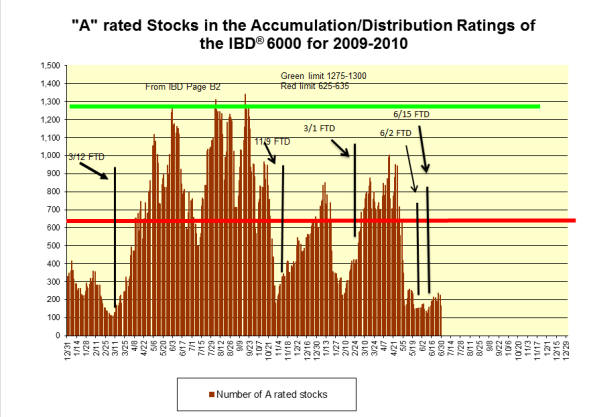
Institutional buying and/or selling determines market direction. To gauge the extent of that pressure, observe the number of stocks which are under heavy accumulation in the IBD® 6000 database. The following chart shows the number of stocks rated A in that data base. It should be obvious that institutions are not buying equities in volume.
The Federal Reserve Bank's policy of low interest rates has created a bond market that is dangerous to investors. There is only one way for interest rates to go in the future and that is up. As a result, investors owning bonds will see the value of those bonds deteriorate. Yields in the U.S. are currently near record lows thanks to the financial turmoil in the Eurozone, Keynesian economics and the supposed "safe-haven status" of the U.S. dollar.
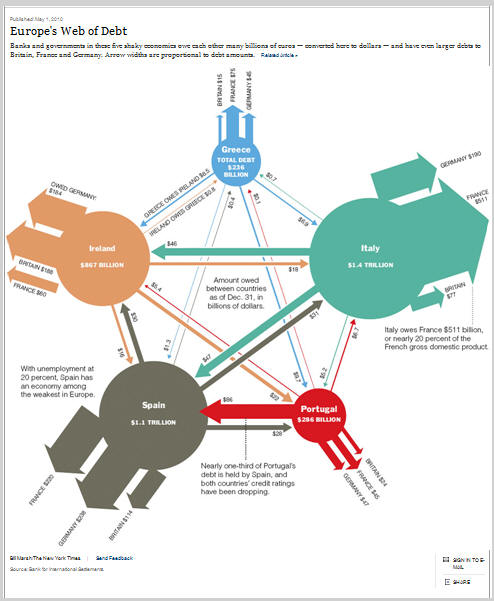
The following chart shows the problem facing the Eurozone in overcoming its financial mess. Basically, only Germany has the financial reserves to help solve the mess of a currency that is not a political union. Eurozone countries have loaned massive amounts of capital to other Eurozone countries and now none of them can pay back the amounts owed. The International Monetary Fund (IMF) and the European Central Bank (ECB) think that by cutting spending and additional loans, the problem can be solved.
Most politicians and academics solutions to the financial crisis violate fundamental rule #1 ... You can not borrow your way out of debt!
The German conservative mind-set and work ethic will probably not be willing to yield to the Club Med philosophy and ultimately, the current $1 trillion bailout agreement within the Eurozone will probably come unglued. As a result, the Eurozone may well cease to exist in this decade.
Likewise, the reserve currency status of the U.S. dollar is eroding. As Russia, China and various members of the United Nations are trying to develop an alternative to the U.S. currency, the power of the U.S. printing press must be of concern.
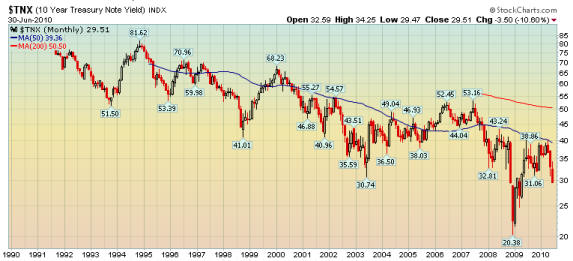
The following chart shows the historic yield on the 10 year US Treasury note since 1990.
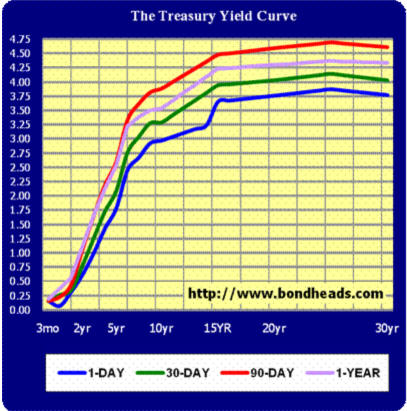
The next chart and table shows the U.S. Treasury yield curve.
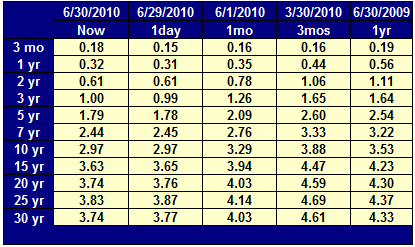
It should be noted that despite these low levels, the U.S. Treasury has seen the average maturity schedule of its financial instruments drop from over 9 years in 1980 and a 9% average interest rate to fifty-five (55) months as of December 2009 and under 3% average interest rate. Borrowing short to finance long-term requirements has never been a wise policy. Yet, for each 1% increase in the average yield, the federal deficit will increase by about $150 billion.
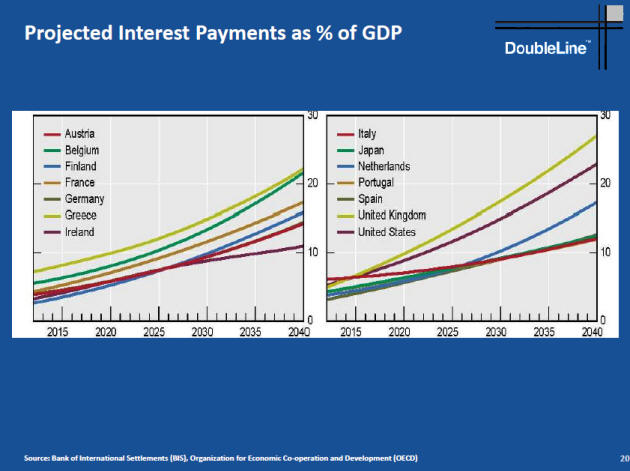
The following chart from a recent Morningstar keynote presentation in June 2010 by Jeffrey Gundlach of DoubleLine shows projected interest payments as a percentage of GDP for selected countries. Rising sovereign debt throughout the world simply can not continue.
The results of the recent Spain and ECB bond auctions of the past two weeks would suggest that investors are becoming increasingly reluctant on a world-wide basis to invest at the current low levels of interest rates and are seeking to adjust the risk/reward ratios to higher levels.
Low interest rates only help borrowers and do not reward investors, many of whom are senior citizens. In effect, low interest rates are hidden confiscatory taxes on investment capital.
The real problem facing the world is that there are too many people and not enough meaningful jobs. Therein lies the seeds for discontent and revolution. Governments can not produce meaningful jobs ... only entrepreneurs can. History has proven that central planning does not work.
The current fiscal and monetary policies of the Obama Administration do not provide the basis for economic recovery. Rather the programs are designed to redistribute and confiscate wealth without making meaningful changes to encourage entrepreneurial innovation, the driving force of economic growth.
Since the beginning of the financial crisis in 2007, various stimulus spending programs have not done anything except increase sovereign debt risk and increase moral hazard. The US economy has not recovered and total non-government jobs remain significantly lower than at the end of 2006. Still the pseudo Keynesian economists like Federal Reserve Bank Chairman Ben Bernanke and Nobel Prize economist Paul Krugman of the NY Times continue to push for more government spending and faster printing presses.
There is simply too much debt at all levels, public or private. The private sector throughout the world including China is deleveraging and that trend will continue which means that private demand will not grow appreciably.
Public debt at all levels as reflected by the difficulties in the Eurozone and elsewhere has reached a level of serious concern. In the U.S. total federal government debt and unfunded liabilities are in excess of $112 trillion according to a study by Jason Saving of the Federal Reserve Bank in Dallas. A $14-$15 trillion economy simply can not afford to pay the interest on such a burden, let alone pay off that debt.
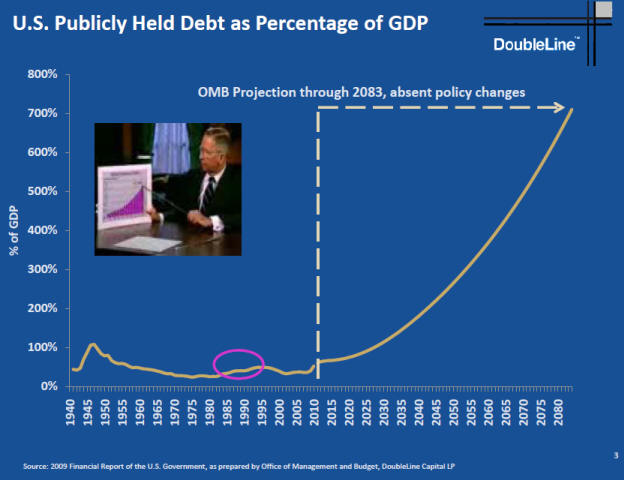
The current Obama spending plans as projected through 2080 which are shown in the following DoubleLine chart are clearly not going to happen. John Maudlin is correct ... "when things can't happen, they won't" ... and this projection falls into that category!
Default and/or hyper-inflation is about the only choice remaining to a country where over 50% of the population receives more benefits than they pay in taxes.
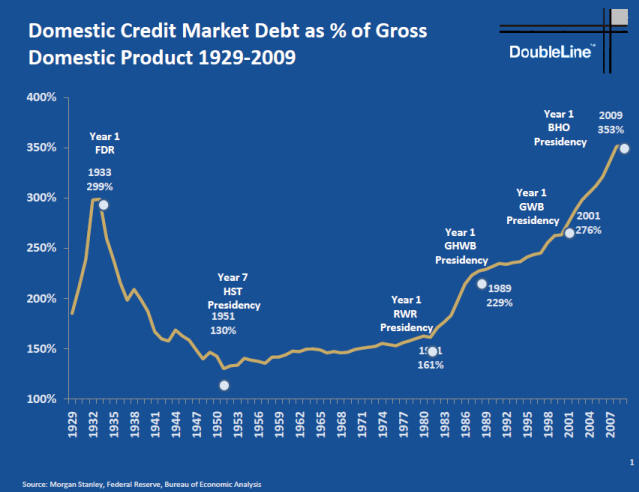
The financial and monetary policies promulgated by politicians on both sides of the aisle have now raised the level of debt in the US to historic levels as seen in the following chart also from DoubleLine.
The number of people receiving food stamps remains about 22% of the population. The Agriculture Department said 39.68 million people, or 1 in 8 Americans, were enrolled for food stamps during February, an increase of 260,000 from January. USDA updated its figures on Wednesday. Enrollment has set a record each month since reaching 31.78 million in December 2008. USDA estimates enrollment will average 40.5 million people this fiscal year, which ends Sept 30, at a cost of up to $59 billion. For fiscal 2011, average enrollment is forecast for 43.3 million people.
The inability of new jobless claims to fall back to levels that were seen in the 2000-2006 period that ranged between 210,000 to 265,000 remains a major concern. Current levels are seen in the following chart showing that new jobless claims are now running between 450,000 to 480,000 per week. In fact, the data just released today shows that new jobless claims rose to 472,000 in the week ended June 26th.
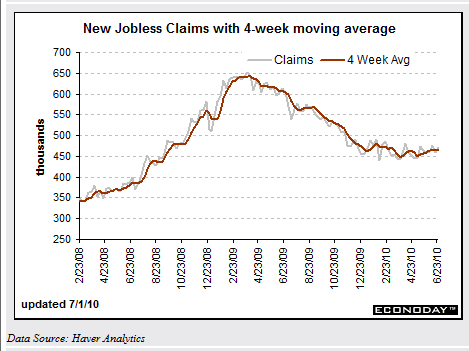
Continuing claims have been edging lower in what is probably a good sign though it may reflect to a degree discouraged workers leaving the workforce. Continuing claims for the June 19 week did rise 43,000 but the four-week average of 4.568 million is about 100,000 lower than mid-May. Almost 10 million unemployed are receiving financial help from one government unemployment program or another.
A doctrine of to big to fail (TBTF) and changing accounting standards have prevented a system cleansing which is sorely needed. Bernie Madoff is not the only person who played fast and loose with investor's money and derivatives. However, a feckless government is unlikely to put many of their major campaign contributors in jail for fraud. The problem has only been pushed down the road and when it returns, the crash will be very bad.
Unlike the new Cameron government in the United Kingdom, the Obama Administration is not proposing any serious reduction of government spending. Health care and financial reform do not decrease the tax burden and/or regulatory environment that entrepreneurs face. Rather the uncertainty of those laws coupled with the proposal for a VAT tax and/or cap and trade legislation provide an environment going forward that makes it very difficult for entrepreneurs to want to risk capital.
The economy is probably going to enter a double-dip slowdown, if not something worse. Earnings for the 2nd quarter will probably show improvement because of the comparison with a depressed 2009. However, watch for top line sales growth and if it is not present, the economy will remain comatose if not worse.
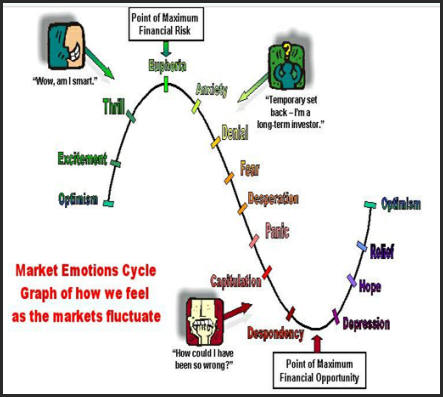
During the past six months, the markets have been responding to a statistical recovery that is based upon seasonal and hedonic adjusted data that upon revision is always worse than initially reported. It is my opinion that we are now seeing the beginning of understanding by many investors that the data as reported is not what is actually happening. The question for investors is to decide where the markets are located on the following graph as emotions are often more potent in determining market trends than fundamentals.
The upcoming fall elections will be critical in determining the outcome of future policy. Will a change in policy encourage entrepreneurs to take risks and develop new businesses and technologies to provide meaningful jobs to society?
Therefore, prudent investors should be extremely cautious going forward. The last two follow-through days (FTD) which IBD® defined failed quickly. The economy going forward is facing additional burdens from taxes, increased regulation and government spending. The US and world economy are facing the problem of too many people and not enough meaningful jobs. Until politicians realize that basic problem exists, not only the U.S. but the world economies are in for a few years of economic stress, or maybe, longer.
But then - 'Tis Only My Opinion!
Fred Richards
July 1, 2010
Corruptisima republica plurimae leges. [The more corrupt a republic, the more laws.] -- Tacitus, Annals III 27
This issue of 'Tis Only My Opinion was
copyrighted by Strategic Investing in 2010.
All rights reserved. Quotation with attribution is encouraged.
'Tis Only My Opinion is intended to provoke thinking, then dialogue among
our readers.
![]()
![]() 'Tis Only My Opinion! Archive Menu
'Tis Only My Opinion! Archive Menu
Last updated - December 20, 2009